The purpose of the Market Balance Analysis report is to show a list of products along with the products they are being sold with the most and how often they are on sales orders together. More specifically, it will show these results based on sales orders that were created between the date specified upon running the report until today. Also the numbers are based on the number of distinct orders and not ordered quantities.
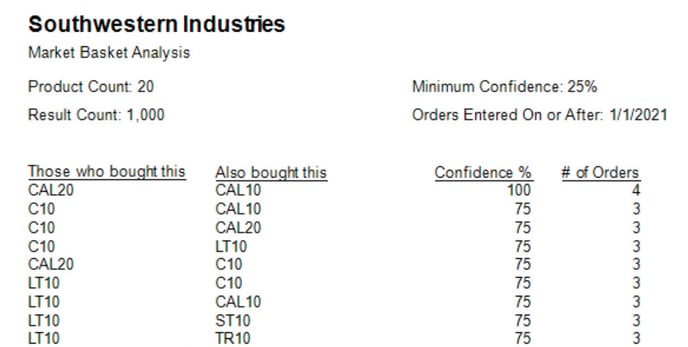
The main value this report includes is known as Confidence. In short, this is a percentage of orders where the first product is being sold with the second product in comparison to the total orders the first product was being sold on. The sales orders used in the calculation of this list are all those that were created between the date specified (Orders Entered On or After) until today.
What are the required Selection Criteria for?
Unlike most reports in Acctivate, the Market Balance Analysis report requires some values to be entered in order to function.
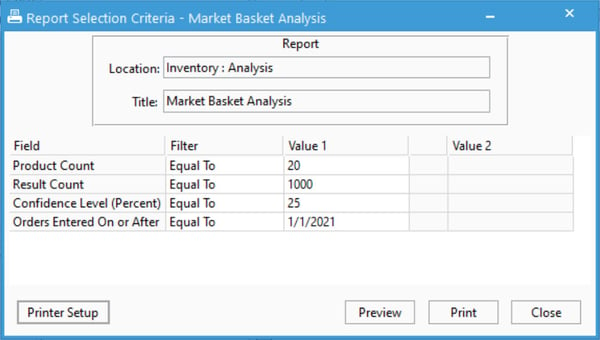
- Product Count restricts the analysis to the top N most purchased products by sales order count (not qty ordered) during the timeframe defined by the On or After date and the present.
- Result Count is the maximum lines to display in the report. The actual record count that displays may be fewer due to the other filters limiting the results.
- Confidence Level (Percent) specifies the minimum confidence level (%) of the results to return. 25 is a reasonable default and means to only return results in which product A was bought on 25% or more orders when product B was purchased.
- Orders Entered On or After limits the orders included in the report calculations by the orders' creation date. A typical value could be two or three months prior to today. Seasonal or fashion-related businesses may want to restrict the results to more recent orders.
How are the Market Balance Analysis results calculated?
After entering the four parameters for the Market Balance Analysis report, the following will take place in order to display results:
- A list is generated for all sales order, credit memos, quotes, and service orders that have an Entry Date on or after the Orders Entered On or After parameter and are not Cancelled. This will be referenced as @Orders.
- A list of all products with the Item Type "Inventoried" that also have line items with positive ordered quantities for orders in the @Orders list. A count for the number of orders that each product is on in this list is kept with said product. The final results of this list are limited the to products with the highest order count which is set with the Product Count parameter. This will be referenced as @Products.
- A list of products within @Products that are on order line items with a different product in @Products is created. As with above, only lines with positive ordered quantities are included. This list also includes a number of distinct orders these products are on together. To clarify, there might be one line for product A sold with product B and another line where product B was sold with product A which becomes important in the next steps. This list will be referenced as @SoldWith.
- For each record in @SoldWith, a Confidence is calculated. This is the count found in @SoldWith divided by the number of @Product records for the first product in @SoldWith. In other words, it's a percentage of orders where the first product is sold with the second product compared with the total number of orders the first product was sold on.
- Next, this @SoldWith list is reduced to all of the records with a Confidence that is greater than or equal to the Confidence Level (Percent) parameter.
- Finally, @SoldWith is reduced down to the number of total records specified in the Result Count parameter. @SoldWith is sorted by Confidence from highest to lowest before doing this. These are the final results the report will use and display.