The purpose of the "Inventory Overstock Analysis" and "Min Stock Level Analysis by Product" reports is to calculate what the average usage was for each product over a period of days specified since today's date (Last N Days) and use that average to approximate how much of that product should be in your warehouse(s) to cover a number of days of usage. In short, it attempts to answer the question "How much of a product should I have in inventory?" This can be helpful if you would like to see if you might be over-stocking or under-stocking certain products which is helpful in informing what the minimum and maximum stocking quantities should be for use in reorders.
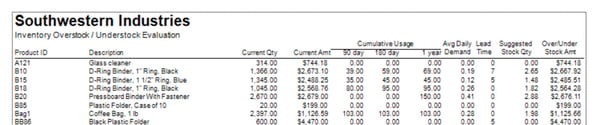
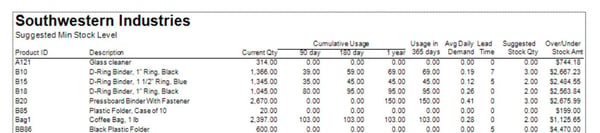
The only true differences between these two reports is that the Inventory Overstock Analysis report has a "Current Amount" column to show the current inventory value for that product while the Min Stock Level Analysis by Product report instead has a "Usage in N days" column to show the total usage over the number of days entered upon running the report.
NOTE: Since these reports only utilize a simple average of product usage over a given time frame, it doesn't take into account seasonal variation in that usage.
For example, if the vast majority of sales for your company are within two months, using an entire year for your Last N Days won't give a very accurate approximation for the inventory you should stock since the average will make the suggested quantity for slow months high and the busy months extremely low.
What are the two required Selection Criteria for?
Unlike many reports in Acctivate, the Inventory Stock Analysis and Min Stock Level Analysis by Product report requires some values to be entered in order to function.
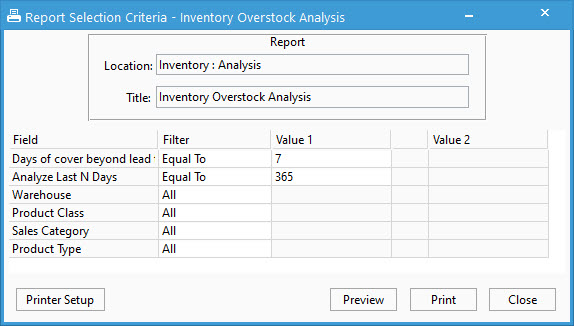
- "Analyze Last N Days" is the number of days of usage from today's date that will be covered when calculating the Avg Daily Demand column seen in the report. For example, and year could be entered as "365" and a month as "30".
- "Days of cover beyond lead time" is the number of days that should be covered with the current stock of inventory. In other words, how long is your stock on hand for a given product expected to last based on typical usage? For example, if you expect it to last a week, enter "7".
How is the usage calculated?
In this report, usage is based off of sales transactions, inventory issues, and assemblies where the product is used as a component. Each of these posted transactions within the "Last N Days" specified in the selection criteria will have their quantities summed together to get the total usage for N days. This value isn't shown on the report itself but is instead used to calculate the average daily demand or usage.
Avg Daily Demand = N Days Usage / N Days
After this is found, the average daily usage is used along with the "Days of cover beyond lead time" and the lead time of the product's preferred vendor to calculate how much of the product would be needed to fulfill average usage in the days of cover specified. This is the value you might use to define your minimum stocking quantity when utilizing the Reorders tab of Business Alerts.
Suggested Stock Qty = Avg Daily Usage * (Days to Cover + Vendor's Lead Time)
The Over/Under Stock Amt column is simply the difference between the current dollar value of the product within inventory now and the dollar value of the Suggested Stock Qty calculated by this report. This is meant to show how much you should decrease (or increase if negative) your inventory to meet the Suggested Stock Qty.
Over/Under Stock Amt = Current Amt - ((Suggested Stock Qty / Current Qty) * Current Amt)
What are the other parts of the report?
The Current Qty and Current Amt are simply the total quantity and dollar value for each product currently in inventory at the time of printing the report. The Cumulative Usage section shows the usage calculated for the last 90 days, 180 days, and year to give a frame of the usage over different periods, regardless of the Last N Days entered for the calculation. None of these fields are affected by the Last N Days or Days of Cover entered when running the report.
The Min Stock Level Analysis by Product omits the "Current Amt" column and instead includes a "Usage in N days" column which shows the cumulative usage for a product in the "Last N Days" that is entered upon running this report. This column may be more useful than seeing the 90 day, 180 day, and 1 year cumulative usages or the average daily usage that shows in both reports.
At the end of the report, there is also a summary based on the calculated values. It states the current total value of the products in the report, how much it should be reduced by (increased if negative) by amount and percentage, and finally what the total value is for the Suggested Stock Qty that the reduction would take you to.